Data Driven Cheatsheets

Guest post by Jonathan Sidi

Cheatsheets are currently built and used exclusivley as a teaching tool. We want to try and change this and produce a cheat sheet that gives a roadmap to build a known product, but also is built as a function so users can input data into it to make the cheatsheet more personalized. This gives a versalility of a consistent format that people can share with each other, but has the added value of conveying a message through data driven visual changes.

Example

ggplot2 themes

The ggplot2 theme object is an amazing object you can specify nearly any part of the plot that is not conditonal on the data. What sets the theme object apart is that its structure is consistent, but the values in it change. In addition to change a theme it is a single function that too has a consistent call. The reoccuring challenge for users is to remember all the options that can be used in the theme call (there are approximately 220 unique options to calibrate at last count) or bookmark the help page for the theme and remember how you deciphered it last time.

This becomes a problem to pass all the information of the theme to someone who does not know what the values are set in your theme and attach instructions on it to let them recreate it without needing to open any web pages.

In writing the library ggedit we tried to make it easy to edit your theme so you don’t have to know too much about ggplots to make a large number of changes at once, for a quick clip see here. We had to make it easy to track those changes for people who are not versed in R, and plot.theme() was the outcome. In short think of the theme as a lot of small images that are combined to create a singel portrait.

Continue reading “Data Driven Cheatsheets”

Presidential Election Predictions 2016 (an ASA competition)

Guest post by Jo Hardinprofessor of mathematics, Pomona College.

ASA’s Prediction Competition

In this election year, the American Statistical Association (ASA) has put together a competition for students to predict the exact percentages for the winner of the 2016 presidential election. They are offering cash prizes for the entry that gets closest to the national vote percentage and that best predicts the winners for each state and the District of Columbia. For more details see:

http://thisisstatistics.org/electionprediction2016/

To get you started, I’ve written an analysis of data scraped from fivethirtyeight.com. The analysis uses weighted means and a formula for the standard error (SE) of a weighted mean. For your analysis, you might consider a similar analysis on the state data (what assumptions would you make for a new weight function?). Or you might try some kind of model – either a generalized linear model or a Bayesian analysis with an informed prior. The world is your oyster!

Continue reading “Presidential Election Predictions 2016 (an ASA competition)”

The reproducibility crisis in science and prospects for R

Guest post by Gregorio Santori (<[email protected]>)

The results that emerged from a recent Nature‘s survey confirm as, for many researchers, we are living in a weak reproducibility age (Baker M. Is there a reproducibility crisis? Nature 2016;533:453-454). Although the definition of reproducibility can vary widely between disciplines, in this survey was adopted the version for which “another scientist using the same methods gets similar results and can draw the same conclusions” (Reality check on reproducibility. Nature 2016;533:437). Already in 2009, Roger Peng formulated a definition of reproducibility very attractive: “In many fields of study there are examples of scientific investigations that cannot be fully replicated because of a lack of time or resources. In such a situation there is a need for a minimum standard that can fill the void between full replication and nothing. One candidate for this minimum standard is «reproducible research», which requires that data sets and computer code be made available to others for verifying published results and conducting alternative analyses” (Peng R. Reproducible research and Biostatistics. Biostatistics. 2009;10:405-408). For many readers of R-bloggers, the Peng’s formulation probably means in the first place a combination of R, LaTeX, Sweave, knitr, R Markdown, RStudio, and GitHub. From the broader perspective of scholarly journals, it mainly means Web repositories for experimental protocols, raw data, and source code.

Although researchers and funders can contribute in many ways to reproducibility, scholarly journals seem to be in a position to give a decisive advancement for a more reproducible research. In the incipit of the “Recommendations for the Conduct, Reporting, Editing, and Publication of Scholarly Work in Medical Journals“, developed by the International Committee of Medical Journals Editors (ICMJE), there is an explicit reference to reproducibility. Moreover, the same ICMJE Recommendations reported as “the Methods section should aim to be sufficiently detailed such that others with access to the data would be able to reproduce the results“, while “[the Statistics section] describe[s] statistical methods with enough detail to enable a knowledgeable reader with access to the original data to judge its appropriateness for the study and to verify the reported results“.

In December 2010, Nature Publishing Group launched Protocol Exchange, “[…] an Open Repository for the deposition and sharing of protocols for scientific research“, where “protocols […] are presented subject to a Creative Commons Attribution-NonCommercial licence“.

In December 2014, PLOS journals announced a new policy for data sharing, resulted in the Data Availability Statement for submitted manuscripts.

In June 2014, at the American Association for the Advancement of Science headquarter, the US National Institute of Health held a joint workshop on the reproducibility, with the participation of the Nature Publishing Group, Science, and the editors representing over 30 basic/preclinical science journals. The workshop resulted in the release of the “Principles and Guidelines for Reporting Preclinical Research“, where rigorous statistical analysis and data/material sharing were emphasized.

In this scenario, I have recently suggested a global “statement for reproducibility” (Research papers: Journals should drive data reproducibility. Nature 2016;535:355). One of the strong points of this proposed statement is represented by the ban of “point-and-click” statistical software. For papers with a “Statistical analysis” section, only original studies carried out by using source code-based statistical environments should be admitted to peer review. In any case, the current policies adopted by scholarly journals seem to be moving towards stringent criteria to ensure more reproducible research. In the next future, the space for “point-and-click” statistical software will progressively shrink, and a cross-platform/open source language/environment such as R will be destined to play a key role.

 

Using 2D Contour Plots within {ggplot2} to Visualize Relationships between Three Variables

Guest post by John Bellettiere, Vincent Berardi, Santiago Estrada

The Goal

To visually explore relations between two related variables and an outcome using contour plots. We use the contour function in Base R to produce contour plots that are well-suited for initial investigations into three dimensional data. We then develop visualizations using ggplot2 to gain more control over the graphical output. We also describe several data transformations needed to accomplish this visual exploration.

Continue reading “Using 2D Contour Plots within {ggplot2} to Visualize Relationships between Three Variables”

Election tRends: An interactive US election tracker (using Shiny and Plotly)

Guest post by Jonathan Sidi

Introduction

The US primaries are coming on fast with almost 120 days left until the conventions. After building a shinyapp for the Israeli Elections I decided to update features in the app and tried out plotly in the shiny framework.

As a casual voter, trying to gauge the true temperature of the political landscape from the overwhelming abundance of polling is a heavy task. Polling data is continuously published during the state primaries and the variety of pollsters makes it hard to keep track what is going on. The app self updates using data published publicly by realclearpolitics.com.

The app keeps track of polling trends and delegate count daily for you. You create a personal analysis from the granular level data all the way to distributions using interactive ggplot2 and plotly graphs and check out the general elections polling to peak into the near future.

The app can be accessed through a couple of places. I set up an AWS instance to host the app for realtime use and there is the Github repository that is the maintained home of the app that is meant for the R community that can host shiny locally.

Running the App through Github

(github repo: yonicd/Elections)

#changing locale to run on Windows
if (Sys.info()[1] == "Windows") Sys.setlocale("LC_TIME","C") 

#check to see if libraries need to be installed
libs=c("shiny","shinyAce","plotly","ggplot2","rvest","reshape2","zoo","stringr","scales","plyr","dplyr")
x=sapply(libs,function(x)if(!require(x,character.only = T)) install.packages(x));rm(x,libs)

#run App
shiny::runGitHub("yonicd/Elections",subdir="USA2016/shiny")

#reset to original locale on Windows
if (Sys.info()[1] == "Windows") Sys.setlocale("LC_ALL")

Application Layout:

(see next section for details)

  1. Current Polling
  2. Election Analyis
  3. General Elections
  4. Polling Database

Usage Instructions:

Current Polling

  • The top row depicts the current accumulation of delegates by party and candidate is shown in a step plot, with a horizontal reference line for the threshold needed per party to recieve the nomination. Ther accumulation does not include super delegates since it is uncertain which way they will vote. Currently this dataset is updated offline due to its somewhat static nature and the way the data is posted online forces the use of Selenium drivers. An action button will be added to invoke refreshing of the data by users as needed.
  • The bottom row is a 7 day moving average of all polling results published on the state and national level. The ribbon around the moving average is the moving standard deviation on the same window. This is helpful to pick up any changes in uncertainty regarding how the voting public is percieving the candidates. It can be seen that candidates with lower polling averages and increased variance trend up while the opposite is true with the leading candidates, where voter uncertainty is a bad thing for them.

Snapshot of Overview Plot

Continue reading “Election tRends: An interactive US election tracker (using Shiny and Plotly)”

It’s not the p-values’ fault – reflections on the recent ASA statement (+relevant R resources)

Joint post by Yoav Benjamini and Tal Galili. The post highlights points raised by Yoav in his official response to the ASA statement (available as on page 4 in the ASA supplemental tab), as well as offers a list of relevant R resources.

Summary

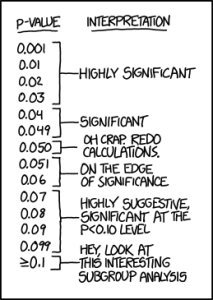
The ASA statement about the misuses of the p-value singles it out. It is just as well relevant to the use of most other statistical methods: context matters, no single statistical measure suffices, specific thresholds should be avoided and reporting should not be done selectively. The latter problem is discussed mainly in relation to omitted inferences. We argue that the selective reporting of inferences problem is serious enough a problem in our current industrialized science even when no omission takes place. Many R tools are available to address it, but they are mainly used in very large problems and are grossly underused in areas where lack of replicability hits hard.

p_valuesSource: xkcd

Continue reading “It’s not the p-values’ fault – reflections on the recent ASA statement (+relevant R resources)”

Setting Rstudio server using Amazon Web Services (AWS) – a step by step (screenshots) tutorial

(this is a guest post by Liad Shekel)

Amazon Web Services (AWS) include many different computational tools, ranging from storage systems and virtual servers to databases and analytical tools. For us R-programmers, being familiar and experienced with these tools can be extremely beneficial in terms of efficiency, style, money-saving and more.

In this post we present a step-by-step screenshot tutorial that will get you to know Amazon EC2 service. We will set up an EC2 instance (Amazon virtual server), install an Rstudio server on it and use our beloved Rstudio via browser (all for free!). The slides below will also include an introduction to linux commands (basic), instructions for connecting to a remote server via ssh and more. No previous knowledge is required.

Useful links:

  1. Set up an AWS account (do not worry about the credit card details, you will not be charged for any of  our actions) – the steps are presented in the slides below.
  2. Windows users: download MobaXterm (or any other ssh client software).
    Mac users: make sure you are familiar with the terminal (cause I’m not).


The ensurer package (validation inside pipes)

Guest post by Stefan Holst Milton Bache on the ensurer package.

If you use R in a production environment, you have most likely experienced that some circumstances change in ways that will make your R scripts run into trouble. Many things can go wrong; package updates, external data sources, daylight savings time, etc. There is a general increasing focus on this within the R community and words like “reproducibility”, “portability” and “unit testing” are buzzing big time. Many really neat solutions are already helping a lot: RStudio’s Packrat project, Revolution Analytic’s “snapshot” feaure, and Hadley Wickham’s testthat package to name a few. Another interesting package under development is Edwin de Jonge’s “validate” package.

I found myself running into quite a few annoying “runtime” moments, where some typically external factors break R software, and more often than not I spent just too much time tracking down where the bug originated. It made me think about how best to ensure that vulnarable statements behaves as expected and how to know exactly where and when things go wrong. My coding style is heaviliy influenced by the magrittr package’s pipe operator, and I am very happy with the workflow it generates:

data <-
  read_external(...) %>%
  make_transformation(...) %>%
  munge_a_little(...) %>%
  summarize_somehow(...) %>%
  filter_relevant_records(...) %T>%
  maybe_even_store

It’s like a recipe. But the problem is that I found no existing way of tagging potentially vulnarable steps in the above process, leaving the choice of doing nothing, or breaking it up. So I decided to make “ensurer”, so I could do:

data <-
  read_external(...) %>%
  ensure_that(all(is.good(.)) %>%
  make_transformation(...) %>%
  ensure_that(all(is.still.good(.))) %>%
  munge_a_little(...) %>%
  summarize_somehow(...) %>%
  filter_relevant_records(...) %T>%
  maybe_even_store

Now, I don’t have a blog, but Tal Galili has been so kind to accept the ensurer vignette as a post for r-bloggers.com. I hope that ensurer can help you write better and safer code; I know it has helped me. It has some pretty neat features, so read on and see if you agree!

Continue reading “The ensurer package (validation inside pipes)”

Analyzing coverage of R unit tests in packages – the {testCoverage} package

(guest post by Andy Nicholls and the team of Mango Business Solutions)

Introduction

Testing is a crucial component in ensuring that the correct analyses are deployed. However it is often considered unglamorous; a poor relation in terms of the time and resources allocated to it in the process of developing a package. But with the increasing popularity and commercial application of R it testing is a subject that is gaining significantly in importance.

At the time of writing there are 5987 packages on CRAN. Due to the nature of CRAN and the motivations of contributors the quality of packages can vary greatly. Some are very popular and well maintained, others are essentially inactive with development having all but ceased. As the number of packages on CRAN continues to grow, determining which packages are fit for purpose in a commercial environment is becomming an increasingly difficult task. There have been numerous articles and blog posts on the subject of CRAN’s growth and the quality of R packages. In particular, Francis Smart’s R-bloggers post entitled Does R have too many packages? highlights five perceived concerns with the growing number of R packages. I would like to expand on one of these themes in particular, namely the “inconsistent quality of individual packages”.

There are many ways in which a package can be assessed for quality. Popularity is clearly one: if lots of people use it then it must be quite good! But popular packages tend to also have authors that actively develop their packages and fix bugs as users identify them. Development activity is therefore another factor; the length of time that a package has existed for; the package dependency tree and the number of reverse ‘Depends’, ‘Imports’ and ‘Suggests’; the number of authors and their reputation; and finally there is testing. Francis briefly mentions testing in his post noting that “testing is still largely left up to the authors and users”. In other words there is no requirement for an author to write tests for their package and often they don’t!

Continue reading “Analyzing coverage of R unit tests in packages – the {testCoverage} package”

Simpler R coding with pipes > the present and future of the magrittr package

Background

It has only been 7 months and a bit since my initial magrittr commit to GitHub on January 1st. It has had more success than I had anticipated, and it appears that I was not quite alone with a frustration which caused me to start the magrittr project. I am not easily frustrated with R, but after a few weeks working with F# at work, I felt it upon returning to R: I had gotten used to writing code in a different way — all nicely aligned with thought and order of execution. The forward pipe operator |> was so addictive that being unable to do something similar in R was more than mildly irritating. Reversing thought, deciphering nested function calls, and making excessive use of temporary variables almost became deal breakers! Surprisingly, I had never really noticed this before, but once I did my returning to R became a difficult crossing.

An amazing thing about R is that it is a very flexible language and the problem could be solved. The |> operator in F# is indeed very simple: it is defined as let (|>) x f = f x. However, the usefulness of this simplicity relies heavily on a concept that is not available in Rpartial application. Furthermore, functions in F# almost always adhere to certain design principles which make the simple definition sufficient. Suppose that f is a function of two arguments, then in F# you may apply f to only the first argument and obtain a new function as the result — a function of the second argument alone. This is partial application, and works with any number of arguments, but application is always from left to right in the argument list. This is why the most important argument (and the one most likely to be a left-hand side object in the pipeline) is almost always the last argument, which in turn makes the simple definition of |> work. To illustrate, consider the following example:

some_value |> some_function other_value

Here, some_function is partially applied to other_value, creating a new function of a single argument, and by the simple definition of |>, this is applied to some_value.

It was clear to me that because R is lacking native partial application and conventions on argument order, no simple solution would be satisfactory, although definitely possible, see e.g. here or here. I wanted to make something that would feel natural in R, and which would serve the main purpose of improving cognitive performance of those writing the code, and of those reading the code.

It turned out that while I was working on magrittr’s %>% operator, Hadley Wickham and Romain Francois was implementing a similar %.% operator in their dplyr package which they announced on January 17. However, it was not quite as flexible, and we thought that piping functionality was better placed in its own more light-weight package. Hadley joined the magrittr project, and in dplyr 2.0 the %.% operator was deprecated — instead%>% was imported from magrittr.

Continue reading “Simpler R coding with pipes > the present and future of the magrittr package”