“Why do people contribute to the R?” – concolusions from a new PNAS article

tl;dr: People contribute to R for various reasons, which evolves with time. The main reasons appear to be: “fun coding”, personal commitment to the community, interaction with like-minded and/or important people  – leading to higher self-esteem, future job opportunities, a chance to express oneself and enjoyable social inclusion.

From the abstract

One of the cornerstones of the R system for statistical computing is the multitude of packages contributed by numerous package authors. This amount of packages makes an extremely broad range of statistical techniques and other quantitative methods freely available. Thus far, no empirical study has investigated psychological factors that drive authors to participate in the R project. This article presents a study of R package authors, collecting data on different types of participation (number of packages, participation in mailing lists, participation in conferences), three psychological scales (types of motivation, psychological values, and work design characteristics), and various socio-demographic factors. The data are analyzed using item response models and subsequent generalized linear models, showing that the most important determinants for participation are a hybrid form of motivation and the social characteristics of the work design. Other factors are found to have less impact or influence only specific aspects of participation.

Summary of results

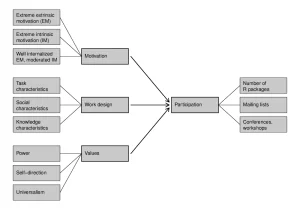
R developers, statisticians, and psychologists from Harvard University, University of Vienna, WU Vienna University of Economics, and University of Innsbruck empirically studied psychosocial drivers of participation of R package authors. Through an online survey they collected data from 1,448 package authors. The questionnaire included psychometric scales (types of motivation, psychological values, work design), sociodemografic variables related to the work on R, and three participation measures (number of packages, participation in mailing lists, participation in conferences).

cranpnas-dia

The data were analyzed using item response models and subsequently generalized linear models (logistic regressions, negative-binomial regression) with SIMEX corrected parameters.

The analysis reveals that the most important determinants for participation are a hybrid form of motivation and the social characteristics of the work design. Hybrid motivation acknowledges that motivation is a complex continuum of intrinsic, extrinsic, and internalized extrinsic motives.
Motives evolve over time, as task characteristics shift from need-driven problem solving to mundane maintenance tasks within the R community.
For instance, motivation can evolve from pure “fun coding” towards a personal commitment with associated higher responsibilities within the community. The community itself provides a social work environment with high degrees of interaction, two facets of which are strong motivators. First, interaction with persons perceived as important increases one’s own reputation (self-esteem, future job opportunities, etc.) Second, interaction with alike minded persons (i.e., interested in solving statistical problems) creates opportunities to express oneself and enjoy social inclusion.

The findings do not substantiate the commonly held perception that people develop packages out of purely altruistic motives. It is also notable that in most cases package development is undertaken as part of an individual’s research, which is paid by an (academic) institution, rather than uncompensated developments that cut into leisure time.

Full paper (behind PNAS’s paywall for now) is available here:

Mair, P., Hofmann, E., Gruber, K., Hatzinger, R., Zeileis, A., and Hornik, K. (2015). Motivation, values, and work design as drivers of participation in the R
open source project for statistical computing. Proceedings of the National Academy of Sciences of the United States of America, 112(48), 14788-14792
 

R-users.com: invite fellow R-users to Jobs, conferences, and R-projects

Dear R users,

I am happy to officially announce a new website called R-users.com. The idea of the site is that community members will invite other R users to join them in their R projects, conferences, and work places.

R-users_homepage_screeshot

This site is a “job board” for R users, hosting various “call to action” to R-users, to do stuff such as:

  1. Join a open-source or paid projects of R programming
  2. Send/give a presentation for conferences (on R, statistics, machine learning, data science, etc.)
  3. Apply to be a student/researcher in an academic institution
  4. And other “R jobs”

For example, I am the author of the R package “installr” for easily updating R on windows. However, I would love for someone who is a mac/linux user to expend my package for non-Windows users. Hence, I created a new “job”, inviting help on this project, which you may see in this link.

If you also wish to post your own “R job” for other R-users to see, here is a very short presentation on how to do it:

The basic steps are:

  1. Register/login to the site (you can use your facebook/gmail account with just one click-registration)
  2. Fill in your proposed project/job details
  3. That’s it!

I intend to promote this site on r-bloggers.com, please help me in promoting this site on facebook and your own websites – so that more of us will be able to work together.

Yours,
Tal Galili

R-bloggers: an example of how interest networks propel viral events

A guest post by Jeff Hemsley, who has co-authored with Karine Nahon a new book titled Going Viral.
————————-

In Going Viral (Polity Press, 2013) we explore the topic of virality, the process of sharing messages that results in a fast, broad spread of information. What does that have to do R, or the R-bloggers community? First and foremost, we use the R-bloggers community as an example of the role of interest networks (see description below) in driving viral events. But we also used R as our go-to tool for our research that went into the book. Even the cover art, pictured here, was created with R, using the iGraph package. Included below is an excerpt from chapter 4 that includes the section on interest networks and R-bloggers.

GoingViral

Continue reading “R-bloggers: an example of how interest networks propel viral events”

Top 100 R packages for 2013 (Jan-May)!

What are the top 100 (most downloaded) R packages in 2013? Thanks to the recent release of RStudio of their “0-cloud” CRAN log files (but without including downloads from the primary CRAN mirror or any of the 88 other CRAN mirrors), we can now answer this question (at least for the months of Jan till May)!

By relying on the nice code that Felix Schonbrodt recently wrote for tracking packages downloads, I have updated my installr R package with functions that enables the user to easily download and visualize the popularity of R packages over time. In this post I will share some nice plots and quick insights that can be made from this great data. The code for this analysis is given at the end of this post.

Top 8 most downloaded R packages – downloads over time

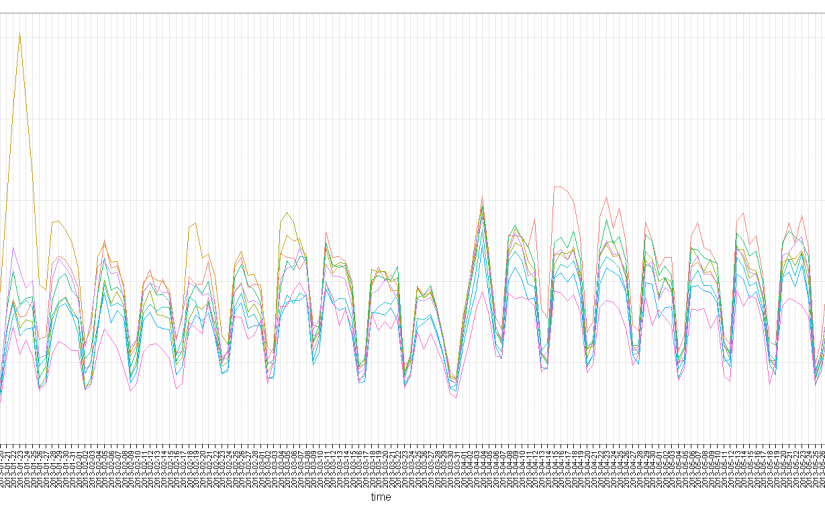
Let’s first have a look at the number of downloads per day for these 5 months, of the top 8 most downloaded packages (click the image for a larger version):

top_8_R_Packages_over_time

We can see the strong weekly seasonality of the downloads,  with Saturday and Sunday having much fewer downloads than other days. This is not surprising since we know that the countries which uses R the most have these days as rest days (see James Cheshire’s world map of R users). It is also interesting to note how some packages had exceptional peaks on some dates. For example, I wonder what happened on January 23rd 2013 that the digest package suddenly got so many downloads, or that colorspace started getting more downloads from April 15th 2013.

“Family tree” of the top 100 most downloaded R packages

We can extract from this data the top 100 most downloaded R packages. Moreover, we can create a matrix showing for each package which of our unique ids (censored IP addresses), has downloaded which package. Using this indicator matrix, we can thing of the “similarity” (or distance) between each two packages, and based on that we can create a hierarchical clustering of the packages – showing which packages “goes along” with one another.

With this analysis, you can locate package on the list which you often use, and then see which other packages are “related” to that package.  If you don’t know that package – consider having a look at it – since other R users are clearly finding the two packages to be “of use”.

Such analysis can (and should!) be extended. For example, we can imagine creating a “suggest a package” feature based on this data, utilizing the package which you use, the OS that you use, and other parameters.  But such coding is beyond the scope of this post.

Here is the “family tree” (dendrogram) of related packages:

Family_tree_of_Top_100_R_Packages

To make it easier to navigate, here is a table with links to the top 100 R packages, and their links:

Continue reading “Top 100 R packages for 2013 (Jan-May)!”

Answering "How many people use my R package?"

The question “How many people use my R package?” is a natural question that (I imagine) every R package developer asks himself at some point or another. After many years in the dark, a silver lining has now emerged thanks to the good people at RStudio. Just yesterday, a blog post by Hadley Wickham was written about the newly released CRAN log files of the RStudio cloud CRAN!

Already out, and the R blogosphere started buzzing with action: James Cheshire created a beautiful world map which highlights the countries based on how much people there use of R. Felix Schonbrodt wrote a great post on Tracking CRAN packages downloads. In the meantime, I’ve started crafting some basic functions for package developers to easily check how many users downloaded their package. These functions are now available on the installr package github page.

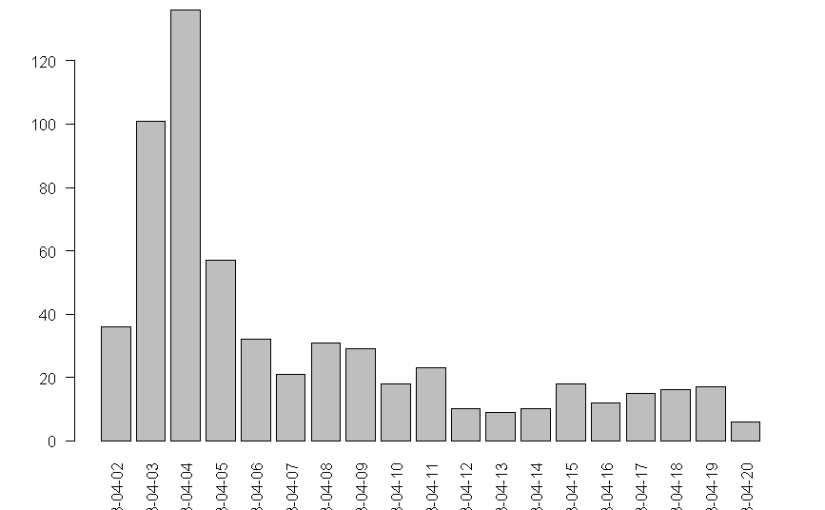
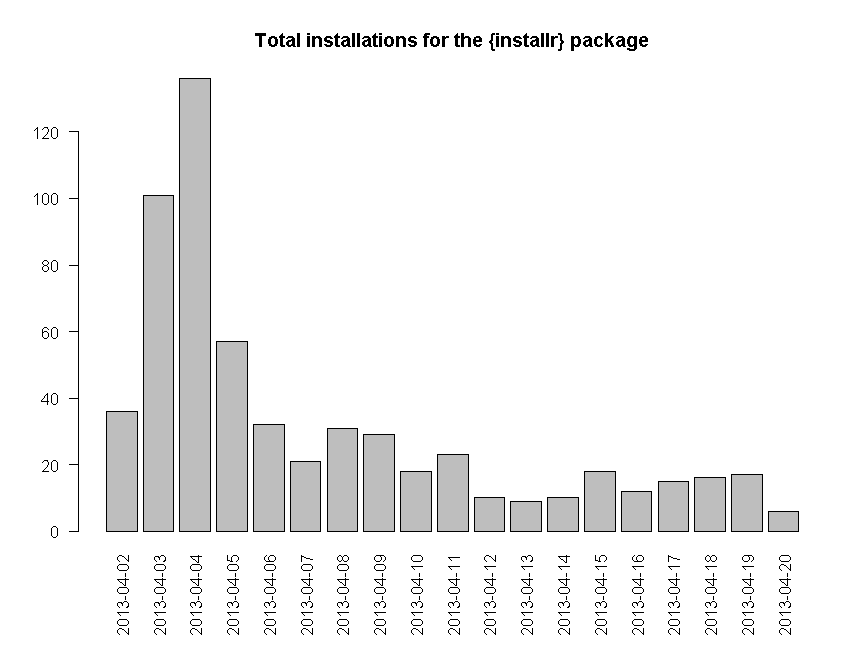
Here is the output for the number of unique ips who downloaded the installr package around the time R 3.0.0 was released (click to see a larger image):

installr_installations_per_day

And here is the code to allow you to make a similar plot for the package which interests you:

# if (!require('devtools')) install.packages('devtools'); require('devtools')
# make sure you have Rtools installed first! if not, then run:
#install_Rtools()
#install_github('installr', 'talgalili') # get the latest installr R package
# or run the code from here:
# https://github.com/talgalili/installr/blob/master/R/RStudio_CRAN_data.r

if(packageVersion("installr") %in% c("0.8","0.9","0.9.2")) install.packages('installr') #If you have one of the older installr versions, install the latest one....

require(installr)

# The first two functions might take a good deal of time to run (depending on the date range)
RStudio_CRAN_data_folder <- download_RStudio_CRAN_data(START = '2013-04-02', END = '2013-04-05') # around the time R 3.0.0 was released
my_RStudio_CRAN_data <- read_RStudio_CRAN_data(RStudio_CRAN_data_folder)

 # barplots: (more functions can easily be added in the future)
barplot_package_users_per_day("plyr", my_RStudio_CRAN_data)
barplot_package_users_per_day("installr", my_RStudio_CRAN_data)

If you (the reader) are interested in helping me extend (/improve) these functions, please do so - I'd be happy to accept pull requests (or comments/e-mails).

R 3.0.0 is released! (what's new, and how to upgrade)

A few hours ago Peter Dalgaard (of R Core Team) announced the release of R 3.0.0!  Bellow you can read the changes in this release.

One of the features worth noticing is the introduction of long vectors to R 3.0.0. As David Smith recently wrote:

Although many people won’t notice the difference, the introduction of long vectors to R is in fact a significant upgrade, and required a lot of work behind-the-scenes to implement in the core R engine. It will allow data frames to exceed their current 2 billion row limit, and in general allow R to make better use of memory in systems with large amounts of RAM. Many thanks go to the R core team for making this improvement.

You can get the source code from:  https://cran.r-project.org/src/base/R-3/R-3.0.0.tar.gz

or wait for it to be mirrored at a CRAN site nearer to you. Binaries for various platforms will appear in due course (which often means it will be within the next 2-48 hours).

If you are running R on Ubuntu, you may wish to consult this post.

If you are running R on Windows, you can use the following code to quickly download and install the latest R version using the installr package:

# installing/loading the package:
if(!require(installr)) {
install.packages("installr"); require(installr)} #load / install+load installr
install.R(to_checkMD5sums = FALSE) # the use of to_checkMD5sums is because of a slight bug in the MD5 file on R 3.0.0. Soon this should get resolved and you could go back to using updateR()

Either way, all users should note that this new release requires that packages will need to be re-installed, which means that after you install the new R, you should run the following command in it:

update.packages(checkBuilt=TRUE)

(thank to Prof. Ripley for the above clarification, and the FAQ pointer)

R 3.0.0 NEWS:

SIGNIFICANT USER-VISIBLE CHANGES

Continue reading “R 3.0.0 is released! (what's new, and how to upgrade)”

100 most read R posts for 2012 (stats from R-bloggers) – big data, visualization, data manipulation, and other languages

R-bloggers.com is now three years young. The site is an (unofficial) online journal of the R statistical programming environment, written by bloggers who agreed to contribute their R articles to the site.

Last year, I posted on the top 24 R posts of 2011. In this post I wish to celebrate R-bloggers’ third birthmounth by sharing with you:

  1. Links to the top 100 most read R posts of 2012
  2. Statistics on “how well” R-bloggers did this year
  3. My wishlist for the R community for 2013 (blogging about R, guest posts, and sponsors)

1. Top 100 R posts of 2012

R-bloggers’ success is thanks to the content submitted by the over 400 R bloggers who have joined r-bloggers.  The R community currently has around 245 active R bloggers (links to the blogs are clearly visible in the right navigation bar on the R-bloggers homepage).  In the past year, these bloggers wrote around 3200 posts about R!

Here is a list of the top visited posts on the site in 2012 (you can see the number of unique visitors in parentheses, while the list is ordered by the number of total page views):

Continue reading “100 most read R posts for 2012 (stats from R-bloggers) – big data, visualization, data manipulation, and other languages”

Calling R lovers and bloggers – to work together on "The R Programming wikibook"

This post is a call for both R community members and R-bloggers, to come and help make The R Programming wikibook be amazing.

The R Programming wikibook is not just another one of the many free books about statistics/R, it is a community project which aims to create a cross-disciplinary practical guide to the R programming language.  Here is how you can join:

Continue reading “Calling R lovers and bloggers – to work together on "The R Programming wikibook"”

A competition to recommend "relevant" R packages – and the future of R

Update: the competition was just launched.
* * *

What is the competition about?

Drew Conway and John Myles Whyte have collected data from (52) R users about the packages they have installed. The data is now available on github for download and the contest will be run on the kaggle platform.

For more details, head over to dataists.

And for fun, here is the dependency graph for R packages they have assembled so far:

A graphical visualization of packages’ “suggestion” relationships. Affectionately referred to as the R Flying Spaghetti Monster. More info below.

A tiny bit more on R bloggers virality

Continue reading “A competition to recommend "relevant" R packages – and the future of R”

Blogging about R – presentation and audio

At the useR!2010 conference I had the honor of giving a (~15 minute) talk titled “Blogging about R”. The following is the abstract I submited, followed by the slides of the talk and the audio file of a recording I made of the talk (I am sad it got a bit of “hall echo”, but it’s still listenable…)

P.S: this post does not absolve me from writing up something (with many thanks and links to people) about the useR2010 conference, but I can see it taking a bit longer till I do that.

—————–

Abstract of the talk

This talk is a basic introduction to blogs: why to blog, how to blog, and the importance of the R blogosphere to the R community.

Because R is an open-source project, the R community members rely (mostly) on each other’s help for statistical guidance, generating useful code, and general moral support.

Current online tools available for us to help each other include the R mailing lists, the community R-wiki, and the R blogosphere. The emerging R blogosphere is the only source, besides the R journal, that provides our community with articles about R. While these articles are not peer reviewed, they do come in higher volume (and often are of very high quality).

According to the meta-blog R-bloggers.com, the (English) R blogosphere has produced, in January 2010, about 115 “articles” about R. There are (currently) a bit over 50 bloggers (now about 100) who write about R, with about 1000 (now ~2200) subscribers who read them daily (through e-mails or RSS). These numbers allow me to believe that there is a genuine interest in our community for more people – perhaps you? – to start (and continue) blogging about R.

In this talk I intend to share knowledge about blogging so that more people are able to participate (freely) in the R blogosphere – both as readers and as writers. The talk will have three main parts:

  • What is a blog
  • How to blog – using the (free) blogging service WordPress.com (with specific emphasis on R)
  • How to develop readership – integration with other social media/networks platforms, SEO, and other best practices

* * *
Tal Galili founded www.R-bloggers.com and blogs on www.R-statistics.com
* * *

Audio recording of the talk

Continue reading “Blogging about R – presentation and audio”