The reproducibility crisis in science and prospects for R

Guest post by Gregorio Santori (<[email protected]>)

The results that emerged from a recent Nature‘s survey confirm as, for many researchers, we are living in a weak reproducibility age (Baker M. Is there a reproducibility crisis? Nature 2016;533:453-454). Although the definition of reproducibility can vary widely between disciplines, in this survey was adopted the version for which “another scientist using the same methods gets similar results and can draw the same conclusions” (Reality check on reproducibility. Nature 2016;533:437). Already in 2009, Roger Peng formulated a definition of reproducibility very attractive: “In many fields of study there are examples of scientific investigations that cannot be fully replicated because of a lack of time or resources. In such a situation there is a need for a minimum standard that can fill the void between full replication and nothing. One candidate for this minimum standard is «reproducible research», which requires that data sets and computer code be made available to others for verifying published results and conducting alternative analyses” (Peng R. Reproducible research and Biostatistics. Biostatistics. 2009;10:405-408). For many readers of R-bloggers, the Peng’s formulation probably means in the first place a combination of R, LaTeX, Sweave, knitr, R Markdown, RStudio, and GitHub. From the broader perspective of scholarly journals, it mainly means Web repositories for experimental protocols, raw data, and source code.

Although researchers and funders can contribute in many ways to reproducibility, scholarly journals seem to be in a position to give a decisive advancement for a more reproducible research. In the incipit of the “Recommendations for the Conduct, Reporting, Editing, and Publication of Scholarly Work in Medical Journals“, developed by the International Committee of Medical Journals Editors (ICMJE), there is an explicit reference to reproducibility. Moreover, the same ICMJE Recommendations reported as “the Methods section should aim to be sufficiently detailed such that others with access to the data would be able to reproduce the results“, while “[the Statistics section] describe[s] statistical methods with enough detail to enable a knowledgeable reader with access to the original data to judge its appropriateness for the study and to verify the reported results“.

In December 2010, Nature Publishing Group launched Protocol Exchange, “[…] an Open Repository for the deposition and sharing of protocols for scientific research“, where “protocols […] are presented subject to a Creative Commons Attribution-NonCommercial licence“.

In December 2014, PLOS journals announced a new policy for data sharing, resulted in the Data Availability Statement for submitted manuscripts.

In June 2014, at the American Association for the Advancement of Science headquarter, the US National Institute of Health held a joint workshop on the reproducibility, with the participation of the Nature Publishing Group, Science, and the editors representing over 30 basic/preclinical science journals. The workshop resulted in the release of the “Principles and Guidelines for Reporting Preclinical Research“, where rigorous statistical analysis and data/material sharing were emphasized.

In this scenario, I have recently suggested a global “statement for reproducibility” (Research papers: Journals should drive data reproducibility. Nature 2016;535:355). One of the strong points of this proposed statement is represented by the ban of “point-and-click” statistical software. For papers with a “Statistical analysis” section, only original studies carried out by using source code-based statistical environments should be admitted to peer review. In any case, the current policies adopted by scholarly journals seem to be moving towards stringent criteria to ensure more reproducible research. In the next future, the space for “point-and-click” statistical software will progressively shrink, and a cross-platform/open source language/environment such as R will be destined to play a key role.
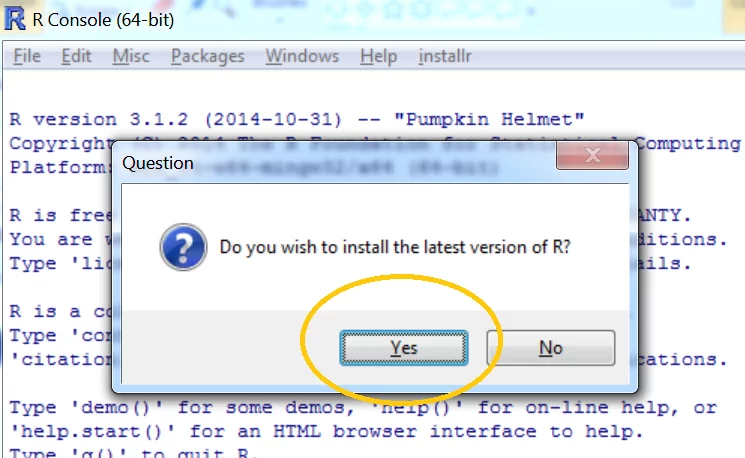
 

A step by step (screenshots) tutorial for upgrading R on Windows

tl;dr

If you are running R on Windows you can easily upgrade to the latest version of R using the installr package. Simply run the following code:

# installing/loading the latest installr package:
install.packages("installr"); library(installr) # install+load installr

updateR() # updating R.

Running “updateR()” will detect if there is a new R version available, and if so it will download+install it (etc.). just press “next”, “OK”, and “Yes” on everything…

A GUI interface to updating R on Windows

Starting from installr version 0.15.0, the upgradingprocess can be done with a click-on-menus GUI interface. Here is how to use it.

Continue reading “A step by step (screenshots) tutorial for upgrading R on Windows”

The ensurer package (validation inside pipes)

Guest post by Stefan Holst Milton Bache on the ensurer package.

If you use R in a production environment, you have most likely experienced that some circumstances change in ways that will make your R scripts run into trouble. Many things can go wrong; package updates, external data sources, daylight savings time, etc. There is a general increasing focus on this within the R community and words like “reproducibility”, “portability” and “unit testing” are buzzing big time. Many really neat solutions are already helping a lot: RStudio’s Packrat project, Revolution Analytic’s “snapshot” feaure, and Hadley Wickham’s testthat package to name a few. Another interesting package under development is Edwin de Jonge’s “validate” package.

I found myself running into quite a few annoying “runtime” moments, where some typically external factors break R software, and more often than not I spent just too much time tracking down where the bug originated. It made me think about how best to ensure that vulnarable statements behaves as expected and how to know exactly where and when things go wrong. My coding style is heaviliy influenced by the magrittr package’s pipe operator, and I am very happy with the workflow it generates:

data <-
  read_external(...) %>%
  make_transformation(...) %>%
  munge_a_little(...) %>%
  summarize_somehow(...) %>%
  filter_relevant_records(...) %T>%
  maybe_even_store

It’s like a recipe. But the problem is that I found no existing way of tagging potentially vulnarable steps in the above process, leaving the choice of doing nothing, or breaking it up. So I decided to make “ensurer”, so I could do:

data <-
  read_external(...) %>%
  ensure_that(all(is.good(.)) %>%
  make_transformation(...) %>%
  ensure_that(all(is.still.good(.))) %>%
  munge_a_little(...) %>%
  summarize_somehow(...) %>%
  filter_relevant_records(...) %T>%
  maybe_even_store

Now, I don’t have a blog, but Tal Galili has been so kind to accept the ensurer vignette as a post for r-bloggers.com. I hope that ensurer can help you write better and safer code; I know it has helped me. It has some pretty neat features, so read on and see if you agree!

Continue reading “The ensurer package (validation inside pipes)”

Plotly Beta: Collaborative Plotting with R

(Guest post by Matt Sundquist on a lovely new service which is pro-actively supporting an API for R)

The Plotly R graphing library  allows you to create and share interactive, publication-quality plots in your browser. Plotly is also built for working together, and makes it easy to post graphs and data publicly with a URL or privately to collaborators.

In this post, we’ll demo Plotly, make three graphs, and explain sharing. As we’re quite new and still in our beta, your help, feedback, and suggestions go a long way and are appreciated. We’re especially grateful for Tal’s help and the chance to post.

Installing Plotly

Sign-up and Install (more in documentation)

From within the R console:

install.packages("devtools")
library("devtools")

Next, install plotly (a big thanks to Hadley, who suggested the GitHub route):

devtools::install_github("plotly/R-api")
# ...
# * DONE (plotly)

Then sign-up like this or at https://plot.ly/:

>library(plotly)
>response = signup (username = 'username', email= 'youremail')
…
Thanks for signing up to plotly!

Your username is: MattSundquist

Your temporary password is: pw. You use this to log into your plotly account at https://plot.ly/plot. Your API key is: “API_Key”. You use this to access your plotly account through the API.

To get started, initialize a plotly object with your username and api_key, e.g.
>>> p <- plotly(username="MattSundquist", key="API_Key")
Then, make a graph!
>>> res <- p$plotly(c(1,2,3), c(4,2,1))

And we’re up and running! You can change and access your password and key in your homepage.

1. Overlaid Histograms:

Here is our first script.

library("plotly")
p <- plotly(username="USERNAME", key="API_Key")

x0 = rnorm(500)
x1 = rnorm(500)+1
data0 = list(x=x0,
             type='histogramx',
opacity=0.8)
data1 = list(x=x1,
             type='histogramx',
opacity=0.8)
layout = list(barmode='overlay')

response = p$plotly(data0, data1, kwargs=list(layout=layout))

browseURL(response$url)

The script makes a graph. Use the RStudio viewer or add “browseURL(response$url)” to your script to avoid copy and paste routines of your URL and open the graph directly.

image001

Continue reading "Plotly Beta: Collaborative Plotting with R"

Analyzing Your Data on the AWS Cloud (with R)

Guest post by Jonathan Rosenblatt

Disclaimer:
This post is not intended to be a comprehensive review, but more of a “getting started guide”. If I did not mention an important tool or package I apologize, and invite readers to contribute in the comments.

Introduction

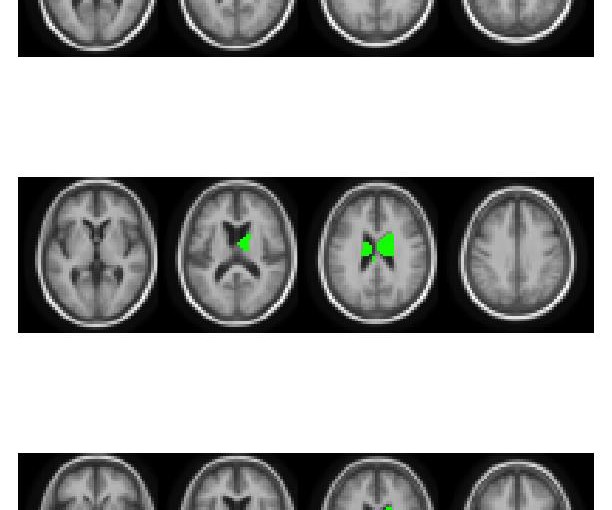
I have recently had the delight to participate in a “Brain Hackathon” organized as part of the OHBM2013 conference. Being supported by Amazon, the hackathon participants were provided with Amazon credit in order to promote the analysis using Amazon’s Web Services (AWS). We badly needed this computing power, as we had 14*109 p-values to compute in order to localize genetic associations in the brain leading to Figure 1.

Figure 1- Brain volumes significantly associated to genotype.
brain_image01

While imaging genetics is an interesting research topic, and the hackathon was a great idea by itself, it is the AWS I wish to present in this post. Starting with the conclusion: 

Storing your data and analyzing it on the cloud, be it AWSAzureRackspace or others, is a quantum leap in analysis capabilities. I fell in love with my new cloud powers and I strongly recommend all statisticians and data scientists get friendly with these services. I will also note that if statisticians do not embrace these new-found powers, we should not be surprised if data analysis becomes synonymous with Machine Learning and not with Statistics (if you have no idea what I am talking about, read this excellent post by Larry Wasserman).

As motivation for analysis in the cloud consider:

  1. The ability to do your analysis from any device, be it a PC, tablet or even smartphone.
  2. The ability to instantaneously augment your CPU and memory to any imaginable configuration just by clicking a menu. Then scaling down to save costs once you are done.
  3. The ability to instantaneously switch between operating systems and system configurations.
  4. The ability to launch hundreds of machines creating your own cluster, parallelizing your massive job, and then shutting it down once done.

Here is a quick FAQ before going into the setup stages.

FAQ

Q: How does R fit in?

Continue reading “Analyzing Your Data on the AWS Cloud (with R)”

Tailor Your Tables with stargazer: New Features for LaTeX and Text Output

Guest post by Marek Hlavac

Since its first introduction on this blog, stargazer, a package for turning R statistical output into beautiful LaTeX and ASCII text tables, has made a great deal of progress. Compared to available alternatives (such as apsrtable or texreg), the latest version (4.0) of stargazer supports the broadest range of model objects. In particular, it can create side-by-side regression tables from statistical model objects created by packages AER, betareg, dynlm, eha, ergm, gee, gmm, lme4, MASS, mgcv, nlme, nnet, ordinal, plm, pscl, quantreg, relevent, rms, robustbase, spdep, stats, survey, survival and Zelig.  You can install stargazer from CRAN in the usual way:

install.packages(“stargazer”)

New Features: Text Output and Confidence Intervals

In this blog post, I would like to draw attention to two new features of stargazer that make the package even more useful:

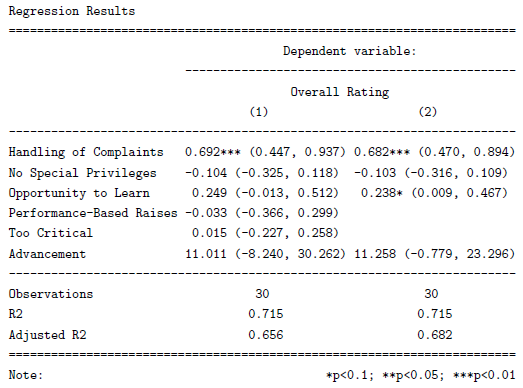
  • stargazer can now produce ASCII text output, in addition to LaTeX code. As a result, users can now create beautiful tables that can easily be inserted into Microsoft Word documents, published on websites, or sent via e-mail. Sharing your regression results has never been easier. Users can also use this feature to preview their LaTeX tables before they use the stargazer-generated code in their .tex documents.
  • In addition to standard errors, stargazer can now report confidence intervals at user-specified confidence levels (with a default of 95 percent). This possibility might be especially appealing to researchers in public health and biostatistics, as the reporting of confidence intervals is very common in these disciplines.

In the reproducible example presented below, I demonstrate these two new features in action.


Reproducible Example

I begin by creating model objects for two Ordinary Least Squares (OLS) models (using the lm() command) and a probit model (using glm() ). Note that I use data from attitude, one of the standard data frames that should be provided with your installation of R.

## 2 OLS models

linear.1 <- lm(rating ~ complaints + privileges + learning + raises + critical, data=attitude)
linear.2 <- lm(rating ~ complaints + privileges + learning, data=attitude)

## create an indicator dependent variable, and run a probit model

attitude$high.rating <- (attitude$rating > 70)
probit.model <- glm(high.rating ~ learning + critical + advance, data=attitude, family = binomial(link = "probit"))

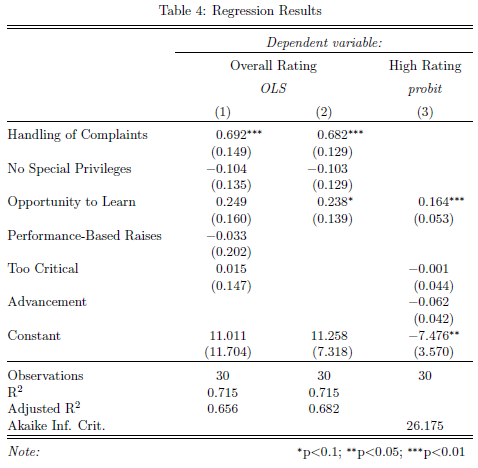
I then use stargazer to create a ‘traditional’ LaTeX table with standard errors. With the sole exception of the argument no.space – which I use to save space by removing all empty lines in the table – both the command call and the resulting table should look familiar from earlier versions of the package:

stargazer(linear.1, linear.2, probit.model, title="Regression Results", align=TRUE, dep.var.labels=c("Overall Rating","High Rating"), covariate.labels=c("Handling of Complaints","No Special Privileges", "Opportunity to Learn","Performance-Based Raises","Too Critical","Advancement"), omit.stat=c("LL","ser","f"), no.space=TRUE)

table_example_1

Continue reading "Tailor Your Tables with stargazer: New Features for LaTeX and Text Output"

Updating R (on Windows) through a menu-bar: installr 0.9 released on CRAN

In preparation for the upcoming release of R 3.0.0, a new release 0.9 of installr is now on CRAN.

The package can be installed and loaded using:

# installing/loading the package:
if(!require(installr)) {
install.packages("installr"); require(installr)} #load / install+load installr

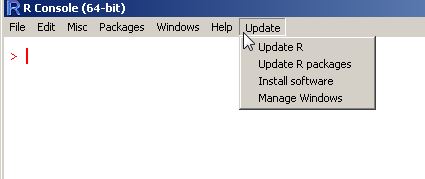
The new version includes various bug fixes (as can be seen in the NEWS file) and new functions and features. The most user visible feature is that from now on, whenever loading installr in the Rgui, it will add a new menu-bar for updating your R version (the menu is removed when the package is detached).

installr_menubar_updateR

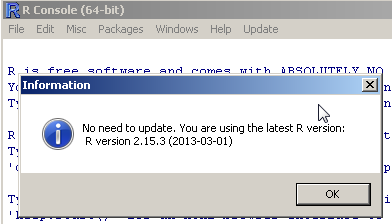
When choosing to update R, a new GUI based system will guide you step by step through the updating process. It will first check if a newer version of R is available, if so, it will offer to show the latest NEWS of that release, download and install the new version, and copy/move your packages from the previous library folder, to the one in the new installation. If you have a global library folder, you can simply stop the updating once your new R is installed, and continue as you would otherwise (in the future, I intend to update the package to also allow it to deal with people using a global library folder).

installr_updateR_noupdate_needed

(for using {installr} to update R through R terminal, see my previous post: Updating R from R (on Windows) – using the {installr} package)

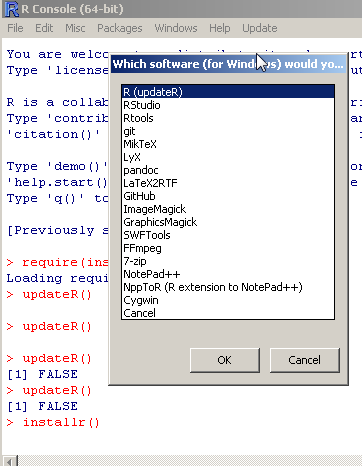
Another new feature is the “installr()” function (which can also be run through the menubar), running it will open a window with a list of software you can download and install using the installr package (From Rtools and RStudio to pandoc and MikTeX).

installr_installr_function

I hope you’ll enjoy this new release, and as always – please let me know in the comments (or via e-mail) if you come across any bugs or have suggestions for new features.

Writing a MS-Word document using R (with as little overhead as possible)

Update (2019-08-17): to see a good solution for this problem, please go to this link. The solution in the post is old and while it still works, it is better to use the newer methods from the link.


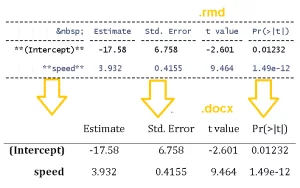
The problem: producing a Word (.docx) file of a statistical report created in R, with as little overhead as possible.
The solution: combining R+knitr+rmarkdown+pander+pandoc (it is easier than it is spelled).

If you get what this post is about, just jump to the “Solution: the workflow” section.

rmd_to_docx

Preface: why is this a problem (/still)

Before turning to the solution, let’s address two preliminary questions:

Q: Why is it important to be able to create report in Word from R?

A: Because many researchers we may work with are used to working with Word for editing their text, tracking changes and merging edits between different authors, and copy-pasting text/tables/images from various sources.
This means that a report produced as a PDF file is less useful for collaborating with less-tech-savvy researchers (copying text or tables from PDF is not fun). Even exchanging HTML files may appear somewhat awkward to fellow researchers.
Continue reading “Writing a MS-Word document using R (with as little overhead as possible)”

Updating R from R (on Windows) – using the {installr} package

Upgrading R on Windows is not easy. While the R FAQ offer guidelines, some users may prefer to simply run a command in order to upgrade their R to the latest version. That is what the new {installr} package is all about.

The {installr} package offers a set of R functions for the installation and updating of software (currently, only on Windows OS), with a special focus on R itself. To update R, you can simply run the following code:

# installing/loading the package:
if(!require(installr)) {
install.packages("installr"); require(installr)} #load / install+load installr

# using the package:
updateR() # this will start the updating process of your R installation.  It will check for newer versions, and if one is available, will guide you through the decisions you'd need to make.

Running this function will perform the following steps:

  • Check what is the latest R version. If the current installed R version is up-to-date, the function ends (and returns FALSE)

  • If a newer version of R is available, you will be asked if to review the NEWS of the latest R version – in order to decide if to install the
    newest R or not.

  • If you wish it – the function will download and install the latest R version. (you will need to press the "next" buttons on your own)

  • Once the installation is done, you should press "any-key", and the function will proceed with copying all of your packages from your old (well, current) R installation, into your newer R installation.

  • You can then erase all of the packages in your old R installation.

  • After your packages are moved (and the old ones possibly erased), you will get the option to update all of your packages in the new version of R.

  • Lastely – you can open the new Rgui and close the current session of your old R. (This is a bit buggy in version 0.8, but has been fixed in version 0.8.1)

If you know you wish to upgrade R, and you want the packages moved (not copied, MOVED), you can simply run:

# installing/loading the package:
if(!require(installr)) { install.packages("installr"); require(installr)} #load / install+load installr

updateR(F, T, T, F, T, F, T) # install, move, update.package, quit R.

Since the various steps are broken into individual functions, you can also pick and choose what to run using the relevant function:

# installing/loading the package:
if(!require(installr)) { install.packages("installr"); require(installr)} #load / install+load installr

# step by step functions:
check.for.updates.R() # tells you if there is a new version of R or not.
install.R() # download and run the latest R installer
copy.packages.between.libraries() # copy your packages to the newest R installation from the one version before it (if ask=T, it will ask you between which two versions to perform the copying)

If you like using the global library system, you can run the following in the old R:

# installing/loading the package:
if(!require(installr)) { install.packages("installr"); require(installr)} #load / install+load installr

updateR(F, T, F, F, F, F, T) # only install R (if there is a newer version), and quits it.

And then run the following in the new version of R:

source("https://www.r-statistics.com/wp-content/uploads/2010/04/upgrading-R-on-windows.r.txt")
New.R.RunMe()

The {installr} package also offers functions for installing various other software on Windows. These functions include: install.pandoc (which was mentioned on this blog recently), install.git, install.Rtools, install.MikTeX, install.RStudio, and a general install.URL and install.packages.zip functions. You can see these further explained in the package’s Reference manual.

Feature requests, bug reports – and your help in improving the package

You can see the latest version of installr on github, where you can also submit bug reports (you may also just leave a comment in this post). Since this is my first R package, I might have (e.g: probably have) missed something here or there. So any comment on how to improve my code/documentation/R-fu, will be most welcomed (here or on github).

If this type of coding is fun/easy for you, you can help me improve this package on github. Cool new features I think may be added (by me or others) are:

  • Add an uninstall.R function – to remove the old R version.
  • Add more support for upgrading R for people who uses a global library for their packages.
  • Add support for Linux and Mac! This one I am less likely to do on my own – and would love to see someone else extend my code to other operation systems.
  • GUI – add a menu based option for running updateR. Something like help->”check for updates” would be great. (p.s: this idea came from Yihui Xie)
  • add even more install.software functions. If you have functions for which you’d like to be able to easily install them – just let me know and it could be included in future releases.

Thanks

Final note, I would like to thank the many people who have developed WONDERFUL tools for making R package development possible (and even somewhat fast), on Windows. These include Prof. Brian Ripley and Duncan Murdoch for Rtools, also Uwe Ligges for his work on CRAN, Hadley Wickham for devtools (in general, and for its documentation), Yihui Xie for roxygen2, JJ and others in the RStudio team for RStudio, the people behind git and github, and more. There are probably more things I can thank these people for, and many more people I should thank, but I can’t figure who you are probably (feel free to e-mail me, I appreciate you work even if it is not clear to me your are behind it).

Installing Pandoc from R (on Windows) – using the {installr} package

The R blogger Rolf Fredheim has recently wrote a great piece called “Reproducible research with R, Knitr, Pandoc and Word“, where he advocates for Pandoc as an essential part of reproducible research workflow in R, in helping to turn documents which are knitted in R into high quality Word for exchanging with our colleagues. It is a great post, with many useful bits of code, and I wanted to supplement it with one missing function: “install.pandoc“.

Update: the install.pandoc function is now part of the {installr} package.

Continue reading “Installing Pandoc from R (on Windows) – using the {installr} package”