heatmaply: an R package for creating interactive cluster heatmaps for online publishing

This post on the heatmaply package is based on my recent paper from the journal bioinformatics (a link to a stable DOI). The paper was published just last week, and since it is released as CC-BY, I am permitted (and delighted) to republish it here in full. My co-authors for this paper are Jonathan Sidi, Alan O’Callaghan, and Carson Sievert.

Summary: heatmaply is an R package for easily creating interactive cluster heatmaps that can be shared online as a stand-alone HTML file. Interactivity includes a tooltip display of values when hovering over cells, as well as the ability to zoom in to specific sections of the figure from the data matrix, the side dendrograms, or annotated labels.  Thanks to the synergistic relationship between heatmaply and other R packages, the user is empowered by a refined control over the statistical and visual aspects of the heatmap layout.

Availability: The heatmaply package is available under the GPL-2 Open Source license. It comes with a detailed vignette, and is freely available from: http://cran.r-project.org/package=heatmaply

Continue reading “heatmaply: an R package for creating interactive cluster heatmaps for online publishing”

heatmaply: interactive heat maps (with R)

I am pleased to announce heatmaply, my new R package for generating interactive heat maps, based on the plotly R package.

tl;dr

By running the following 3 lines of code:

install.packages("heatmaply")
library(heatmaply)
heatmaply(mtcars, k_col = 2, k_row = 3) %>% layout(margin = list(l = 130, b = 40))

You will get this output in your browser (or RStudio console):

Continue reading “heatmaply: interactive heat maps (with R)”

labels.dendrogram in R 3.2.2 can be ~70 times faster (for trees with 1000 labels)

The recent release of R 3.2.2 came with a small (but highly valuable) improvement to the stats:::labels.dendrogram function. When working with dendrograms with (say) 1000 labels, the new function offers a 70 times speed improvement over the version of the function from R 3.2.1. This speedup is even better than the Rcpp version of labels.dendrogram from the dendextendRcpp package.

Here is some R code to demonstrate this speed improvement:

# IF you are missing an of these - they should be installed:
install.packages("dendextend")
install.packages("dendextendRcpp")
install.packages("microbenchmark")


# Getting labels from dendextendRcpp
labelsRcpp% dist %>% hclust %>% as.dendrogram
labels(dend)

And here are the results:

> microbenchmark(labels_3.2.1(dend), labels_3.2.2(dend), labelsRcpp(dend))
Unit: milliseconds
               expr        min         lq     median         uq       max neval
 labels_3.2.1(dend) 186.522968 189.395378 195.684164 208.328365 321.98368   100
 labels_3.2.2(dend)   2.604766   2.826776   2.891728   3.006792  21.24127   100
   labelsRcpp(dend)   3.825401   3.946904   3.999817   4.179552  11.22088   100
> 
> microbenchmark(labels_3.2.2(dend), order.dendrogram(dend))
Unit: microseconds
                   expr      min        lq   median        uq      max neval
     labels_3.2.2(dend) 2520.218 2596.0880 2678.677 2885.2890 9572.460   100
 order.dendrogram(dend)  665.191  712.2235  954.951  996.1055 2268.812   100

As we can see, the new labels function (in R 3.2.2) is about 70 times faster than the older version (from R 3.2.1). When only wanting something like the number of labels, using length on order.dendrogram will still be (about 3 times) faster than using labels.

This improvement is expected to speedup various functions in the dendextend R package (a package for visualizing, adjusting, and comparing dendrograms, which heavily relies on labels.dendrogram). We expect to get even better speedup improvements for larger trees.

dend1000

R 3.2.2 is released

R 3.2.2 (codename “Fire Safety”) was released last weekend. You can get the latest binaries version from here. (or the .tar.gz source code from here). The full list of new features and bug fixes is provided below.

SOME OF THE CHANGES

I personally found two things particularly interesting in this release:

  1. setInternet2(TRUE) is now the default for windows (which will save people from getting “Error in file(con, “r”)” when using the installr package)
  2. The dendrogram method of labels() is much more efficient for large dendrograms since it now uses rapply(). This is expected to speedup various functions in the dendextend R package (a package for visualizing, adjusting, and comparing dendrograms, which heavily relies on labels.dendrogram).

Also, David Smith (from Revolution/Microsoft) highlighted in his post several of the updates in R 3.2.2 he found interesting – mentioning how the new default for accessing the web with R will rely on the HTTPS protocol, and of improving the accuracy in the extreme tails of the t and hypergeometric distributions.

Upgrading to R 3.2.2 on Windows

If you are using Windows you can easily upgrade to the latest version of R using the installr package. Simply run the following code in Rgui:

install.packages("installr") # install 
setInternet2(TRUE)
installr::updateR() # updating R.

Running “updateR()” will detect if there is a new R version available, and if so it will download+install it (etc.). There is also a step by step tutorial (with screenshots) on how to upgrade R on Windows, using the installr package.

I try to keep the installr package updated and useful, so if you have any suggestions or remarks on the package – you are invited to open an issue in the github page.

CHANGES IN R 3.2.2:

SIGNIFICANT USER-VISIBLE CHANGES

  • It is now easier to use secure downloads from https:// URLs on builds which support them: no longer do non-default options need to be selected to do so. In particular, packages can be installed from repositories which offer https:// URLs, and those listed by setRepositories()now do so (for some of their mirrors).Support for https:// URLs is available on Windows, and on other platforms if support forlibcurl was compiled in and if that supports the https protocol (system installations can be expected to do). So https:// support can be expected except on rather old OSes (an example being OS X ‘Snow Leopard’, where a non-system version of libcurl can be used).(Windows only) The default method for accessing URLs via download.file() and url() has been changed to be "wininet" using Windows API calls. This changes the way proxies need to be set and security settings made: there have been some reports of sites being inaccessible under the new default method (but the previous methods remain available).

NEW FEATURES

Continue reading “R 3.2.2 is released”

Slides from my JSM 2015 talk on dendextend

If you happen to be at the JSM 2015 conference this week, then this Monday, at 2pm, I will give a talk on the dendextend R package  (in the session “Advances in Graphical Frameworks and Methods Part 1“) – feel free to drop by and say hi.

Here are my slides for the intended talk:


p.s.: Yes – this presentation is very similar, although not identical, to the one I gave at useR2015. For example, I mention the new bioinformatics paper on dendextend.

dendextend: a package for visualizing, adjusting, and comparing dendrograms (based on a paper from “bioinformatics”)

This post on the dendextend package is based on my recent paper from the journal bioinformatics (a link to a stable DOI). The paper was published just last week, and since it is released as CC-BY, I am permitted (and delighted) to republish it here in full:

abstract

Summary: dendextend is an R package for creating and comparing visually appealing tree diagrams. dendextend provides utility functions for manipulating dendrogram objects (their color, shape, and content) as well as several advanced methods for comparing trees to one another (both statistically and visually). As such, dendextend offers a flexible framework for enhancing R’s rich ecosystem of packages for performing hierarchical clustering of items.

Availability: The dendextend R package (including detailed introductory vignettes) is available under the GPL-2 Open Source license and is freely available to download from CRAN at: (https://cran.r-project.org/package=dendextend)

Contact: [email protected]

Continue reading “dendextend: a package for visualizing, adjusting, and comparing dendrograms (based on a paper from “bioinformatics”)”

dendextend version 1.0.1 + useR!2015 presentation

When using the dendextend package in your work, please cite it using:

Tal Galili (2015). dendextend: an R package for visualizing, adjusting, and comparing trees of hierarchical clustering. Bioinformatics. doi:10.1093/bioinformatics/btv428

My R package dendextend (version 1.0.1) is now on CRAN!

The dendextend package Offers a set of functions for extending dendrogram objects in R, letting you visualize and compare trees of hierarchical clusterings. With it you can (1) Adjust a tree’s graphical parameters – the color, size, type, etc of its branches, nodes and labels. (2) Visually and statistically compare different dendrograms to one another.

The previous release of dendextend (0.18.3) was half a year ago, and this version includes many new features and functions.

To help you discover how dendextend can solve your dendrogram/hierarchical-clustering issues, you may consult one of the following vignettes:

Here is an example figure from the first vignette (analyzing the Iris dataset)

iris_heatmap_dend


This week, at useR!2015, I will give a talk on the package. This will offer a quick example, and a step-by-step example of some of the most basic/useful functions of the package. Here are the slides:


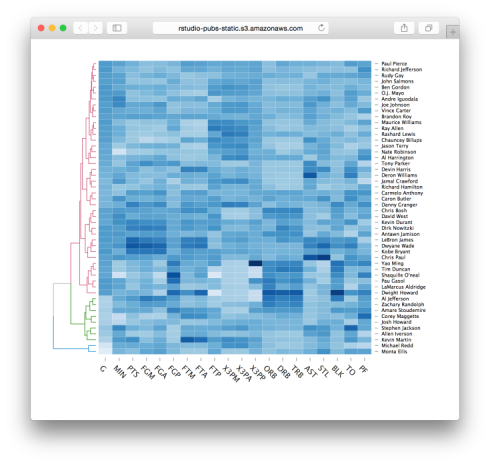
Lastly, I would like to mention the new d3heatmap package for interactive heat maps. This package is by Joe Cheng from Rstudio, and integrates well with dendrograms in general and dendextend in particular (thanks to some lovely github-commit-discussion between Joe and I). You are invited to see lively examples of the package in the post at the RStudio blog. Here is just one quick example:

d3heatmap(nba_players, colors = “Blues”, scale = “col”, dendrogram = “row”, k_row = 3)

d3heatmap

The dendextend package for visualizing and comparing trees of hierarchical clusterings (slides from useR!2014)

When using the dendextend package in your work, please cite it using:

Tal Galili (2015). dendextend: an R package for visualizing, adjusting, and comparing trees of hierarchical clustering. Bioinformatics. doi:10.1093/bioinformatics/btv428

This week I presented in the useR!2014 my package dendextend (also on github), for easily manipulating, visualizing, and comparing dendrograms. Put simply, it is a package designed to easily create figures like these:

2015-06-28 20_58_26-Clipboard

Here is my presentation from useR:

[gview file=”https://www.r-statistics.com/wp-content/uploads/2014/07/2014-07-01-useR2014-03.pdf” profile=”null” save=”1″]

You are also invited to give a look to the current version of the package vignettes:

https://github.com/talgalili/dendextend/blob/master/vignettes/dendextend-tutorial.pdf

I highly welcome features suggestions and bug reports (or just “wow, this is awesome”) sent to my e-mail (tal.galili AT gmail.com), you can also leave a comment or use the github issue page.

A sidenote on useR!2014: this year’s useR conference was wonderful! I enjoyed the many talks, sessions, posters, and especially the so many wonderful R users I got to meet (and I will not try to list all of you – but you know who you are, and how much I enjoyed seeing you!). As corny as it may sound – we, the people who use R, are truly a community. There is a lot to be said about getting to meet so many people who share my own passion for statistical programming, open source, collaboration, open science, and a better future in general. Gladly, you can get a sense of what happened there by having a look at the twitter hashtag #useR2014. Several great R bloggers already started writing about it, you can see their posts here: 1, 2, 3, 4, 5. And I hope more posts will follow. I hope to see you in next year’s useR!2015!