50 years of Data Science – by David Donoho

David Donoho published a fascinating paper based on a presentation at the Tukey Centennial workshop, Princeton NJ Sept 18 2015. You can download the full paper from here. 

The paper got quite the attention on Hacker News, Data Science Central, Simply Stats, Xi’an’s blog, srown ion medium, and probably others. Share your thoughts in the comments.

Here is the abstract and table of content.

Abstract

More than 50 years ago, John Tukey called for a reformation of academic statistics. In ‘The Future of Data Analysis’, he pointed to the existence of an as-yet unrecognized science, whose subject of interest was learning from data, or ‘data analysis’. Ten to twenty years ago, John Chambers, Bill Cleveland and Leo Breiman independently once again urged academic statistics to expand its boundaries beyond the classical domain of theoretical statistics; Chambers called for more emphasis on data preparation and presentation rather than statistical modeling; and Breiman called for emphasis on prediction rather than inference. Cleveland even suggested the catchy name “Data Science” for his envisioned field.

A recent and growing phenomenon is the emergence of “Data Science” programs at major universities, including UC Berkeley, NYU, MIT, and most recently the Univ. of Michigan, which on September 8, 2015 announced a $100M “Data Science Initiative” that will hire 35 new faculty. Teaching in these new programs has significant overlap in curricular subject matter with traditional statistics courses; in general, though, the new initiatives steer away from close involvement with academic statistics departments.

This paper reviews some ingredients of the current “Data Science moment”, including recent commentary about data science in the popular media, and about how/whether Data Science is really different from Statistics.

The now-contemplated field of Data Science amounts to a superset of the fields of statistics and machine learning which adds some technology for ‘scaling up’ to ‘big data’. This chosen superset is motivated by commercial rather than intellectual developments. Choosing in this way is likely to miss out on the really important intellectual event of the next fifty years.

Because all of science itself will soon become data that can be mined, the imminent revolution in Data Science is not about mere ‘scaling up’, but instead the emergence of scientific studies of data analysis science-wide. In the future, we will be able to predict how a proposal to change data analysis workflows would impact the validity of data analysis across all of science, even predicting the impacts field-by-field. Drawing on work by Tukey, Cleveland, Chambers and Breiman, I present a vision of data science based on the activities of people who are ‘learning from data’, and I describe an academic field dedicated to improving that activity in an evidence-based manner. This new field is a better academic enlargement of statistics and machine learning than today’s Data Science Initiatives, while being able to accommodate the same short-term goals.

Contents

1 Today’s Data Science Moment

2 Data Science ‘versus’ Statistics

2.1 The ‘Big Data’ Meme

2.2 The ‘Skills’ Meme

2.3 The ‘Jobs’ Meme

2.4 What here is real?

2.5 A Better Framework

3 The Future of Data Analysis, 1962

4 The 50 years since FoDA

4.1 Exhortations

4.2 Reification

5 Breiman’s ‘Two Cultures’, 2001

6 The Predictive Culture’s Secret Sauce

6.1 The Common Task Framework

6.2 Experience with CTF

6.3 The Secret Sauce

6.4 Required Skills

7 Teaching of today’s consensus Data Science

8 The Full Scope of Data Science

8.1 The Six Divisions

8.2 Discussion

8.3 Teaching of GDS

8.4 Research in GDS

8.4.1 Quantitative Programming Environments: R

8.4.2 Data Wrangling: Tidy Data

8.4.3 Research Presentation: Knitr

8.5 Discussion

9 Science about Data Science

9.1 Science-Wide Meta Analysis

9.2 Cross-Study Analysis

9.3 Cross-Workflow Analysis

9.4 Summary

10 The Next 50 Years of Data Science

10.1 Open Science takes over

10.2 Science as data

10.3 Scientific Data Analysis, tested Empirically

10.3.1 DJ Hand (2006)

10.3.2 Donoho and Jin (2008)

10.3.3 Zhao, Parmigiani, Huttenhower and Waldron (2014)

10.4 Data Science in 2065

11 Conclusion
You can download the full paper from here. 

Generation of E-Learning Exams in R for Moodle, OLAT, etc.

(Guest post by Achim Zeileis)
Development of the R package exams for automatic generation of (statistical) exams in R started in 2006 and version 1 was published in JSS by Grün and Zeileis (2009). It was based on standalone Sweave exercises, that can be combined into exams, and then rendered into different kinds of PDF output (exams, solutions, self-study materials, etc.). Now, a major revision of the package has been released that extends the capabilities and adds support for learning management systems. It is still based on the same type of
Sweave files for each exercise but can also render them into output formats like HTML (with various options for displaying mathematical content) and XML specifications for online exams in learning management systems such as Moodle or OLAT. Supplementary files such as graphics or data are
handled automatically. Here, I give a brief overview of the new capabilities. A detailed discussion is in the working paper by Zeileis, Umlauf, and Leisch (2012) that is also contained in the package as a vignette.
Continue reading “Generation of E-Learning Exams in R for Moodle, OLAT, etc.”

Diagram for a Bernoulli process (using R)

A Bernoulli process is a sequence of Bernoulli trials (the realization of n binary random variables), taking two values (0/1, Heads/Tails, Boy/Girl, etc…). It is often used in teaching introductory probability/statistics classes about the binomial distribution. When visualizing a Bernoulli process, it is common to use a binary tree diagram in order to show the […]

A Bernoulli process is a sequence of Bernoulli trials (the realization of n binary random variables), taking two values (0/1, Heads/Tails, Boy/Girl, etc…). It is often used in teaching introductory probability/statistics classes about the binomial distribution.

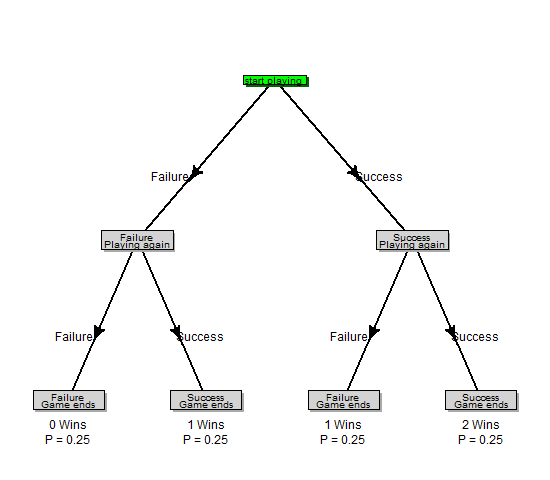
When visualizing a Bernoulli process, it is common to use a binary tree diagram in order to show the progression of the process, as well as the various consequences of the trial. We might also include the number of “successes”, and the probability for reaching a specific terminal node.

I wanted to be able to create such a diagram using R. For this purpose I composed some code which uses the {diagram} R package. The final function should allow one to create different sizes of diagrams, while allowing flexibility with regards to the text which is used in the tree.

Here is an example of the simplest use of the function:

source("https://www.r-statistics.com/wp-content/uploads/2011/11/binary.tree_.for_.binomial.game_.r.txt") # loading the function
binary.tree.for.binomial.game(2) # creating a tree for B(2,0.5)

The resulting diagram will look like this:

The same can be done for creating larger trees. For example, here is the code for a 4 stage Bernoulli process:

source("https://www.r-statistics.com/wp-content/uploads/2011/11/binary.tree_.for_.binomial.game_.r.txt") # loading the function
binary.tree.for.binomial.game(4) # creating a tree for B(4,0.5)

The resulting diagram will look like this:

The function can also be tweaked in order to describe a more specific story. For example, the following code describes a 3 stage Bernoulli process where an unfair coin is tossed 3 times (with probability of it giving heads being 0.8):

source("https://www.r-statistics.com/wp-content/uploads/2011/11/binary.tree_.for_.binomial.game_.r.txt") # loading the function

binary.tree.for.binomial.game(3, 0.8, first_box_text = c("Tossing an unfair coin", "(3 times)"), left_branch_text = c("Failure", "Playing again"), right_branch_text = c("Success", "Playing again"),
    left_leaf_text = c("Failure", "Game ends"), right_leaf_text = c("Success",
        "Game ends"), cex = 0.8, rescale_radx = 1.2, rescale_rady = 1.2,
    box_color = "lightgrey", shadow_color = "darkgrey", left_arrow_text = c("Tails n(P = 0.2)"),
    right_arrow_text = c("Heads n(P = 0.8)"), distance_from_arrow = 0.04)

The resulting diagram is:

If you make up neat examples of using the code (or happen to find a bug), or for any other reason – you are welcome to leave a comment.

(note: the images above are licensed under CC BY-SA)

Article about plyr published in JSS, and the citation was added to the new plyr (version 1.5)

The plyr package (by Hadley Wickham) is one of the few R packages for which I can claim to have used for all of my statistical projects. So whenever a new version of plyr comes out I tend to be excited about it (as was when version 1.2 came out with support for parallel processing)

So it is no surprise that the new release of plyr 1.5 got me curious. While going through the news file with the new features and bug fixes, I noticed how (quietly) Hadley has also released (6 days ago) another version of plyr prior to 1.5 which was numbered 1.4.1. That version included only one more function, but a very important one – a new citation reference for when using the plyr package. Here is how to use it:

install.packages("plyr") # so to upgrade to the latest release
citation("plyr")

The output gives both a simple text version as well as a BibTeX entry for LaTeX users. Here it is (notice the download link for yourself to read):

To cite plyr in publications use:
Hadley Wickham (2011). The Split-Apply-Combine Strategy for Data
Analysis. Journal of Statistical Software, 40(1), 1-29. URL
http://www.jstatsoft.org/v40/i01/.

I hope to see more R contributers and users will make use of the ?citation() function in the future.

Book review: 25 Recipes for Getting Started with R

Recently I was asked by O’Reilly publishing to give a book review for Paul Teetor new introductory book to R.  After giving the book some attention and appreciating it’s delivery of the material, I was happy to write and post this review.  Also, I’m very happy to see how a major publishing house like O’Reilly is producing more and more R books, great news indeed.

And now for the book review:

Executive summary: a book that offers a well designed gentle introduction for people with some background in statistics wishing to learn how to get common (basic) tasks done with R.

Information

By: Paul Teetor
Publisher:O’Reilly
MediaReleased: January 2011
Pages: 58 (est.)

Format

The book “25 Recipes for Getting Started with R” offers an interesting take on how to bring R to the general (statistically oriented) public.

Continue reading “Book review: 25 Recipes for Getting Started with R”

The R Journal, Vol.2 Issue 2 is out

The second issue of the second volume of The R Journal is now available .

Download complete issue

Refereed articles may be downloaded individually using the links below. [Bibliography of refereed articles]

Table of Contents

Editorial3

Contributed Research Articles

Solving Differential Equations in R
Karline Soetaert, Thomas Petzoldt and R. Woodrow Setzer
5
Source References
Duncan Murdoch
16
hglm: A Package for Fitting Hierarchical Generalized Linear Models
Lars Rönnegård, Xia Shen and Moudud Alam
20
dclone: Data Cloning in R
Péter Sólymos
29
stringr: modern, consistent string processing
Hadley Wickham
38
Bayesian Estimation of the GARCH(1,1) Model with Student-t Innovations
David Ardia and Lennart F. Hoogerheide
41
cudaBayesreg: Bayesian Computation in CUDA
Adelino Ferreira da Silva
48
binGroup: A Package for Group Testing
Christopher R. Bilder, Boan Zhang, Frank Schaarschmidt and Joshua M. Tebbs
56
The RecordLinkage Package: Detecting Errors in Data
Murat Sariyar and Andreas Borg
61
spikeslab: Prediction and Variable Selection Using Spike and Slab Regression
Hemant Ishwaran, Udaya B. Kogalur and J. Sunil Rao
68

From the Core

What’s New?74

News and Notes

useR! 201077
Forthcoming Events: useR! 201179
Changes in R81
Changes on CRAN90
News from the Bioconductor Project101
R Foundation News102

New edition of "R Companion to Applied Regression" – by John Fox and Sandy Weisberg

Just two hours ago, Professor John Fox has announced on the R-help mailing list of a new (second) edition to his book “An R and S Plus Companion to Applied Regression”, now title . “An R Companion to Applied Regression, Second Edition”.

John Fox is (very) well known in the R community for many contributions to R, including the car package (which any one who is interested in performing SS type II and III repeated measures anova in R, is sure to come by), the Rcmdr pacakge (one of the two major GUI’s for R, the second one is Deducer), sem (for Structural Equation Models) and more.  These might explain why I think having him release a new edition for his book to be big news for the R community of users.

In this new edition, Professor Fox has teamed with Professor Sandy Weisberg, to refresh the original edition so to cover the development gained in the (nearly) 10 years since the first edition was written.

Here is what John Fox had to say:

Dear all,

Sandy Weisberg and I would like to announce the publication of the second
edition of An R Companion to Applied Regression (Sage, 2011).

As is immediately clear, the book now has two authors and S-PLUS is gone
from the title (and the book). The R Companion has also been thoroughly
rewritten, covering developments in the nearly 10 years since the first
edition was written and expanding coverage of topics such as R graphics and
R programming. As before, however, the R Companion provides a general
introduction to R in the context of applied regression analysis, broadly
construed. It is available from the publisher at (US) or (UK), and from Amazon (see here)

The book is augmented by a web site with data sets, appendices on a variety of topics, and more, and it associated with the car package on CRAN, which has recently undergone an overhaul.

Regards,
John and Sandy

Continue reading “New edition of "R Companion to Applied Regression" – by John Fox and Sandy Weisberg”

Tips for the R beginner (a 5 page overview)

In this post I publish a PDF document titled “A collection of tips for R in Finance”.
It is a basic 5 page introduction to R in finances by Arnaud Amsellem (linked in profile).

The article offers tips related to the following points:

  • Code Editor
  • Organizing R code
  • Update packages
  • Getting external data into R
  • Communicating with external applications
  • Optimizing R code

This article is well articulated, and offers a perspective of someone who is experienced in the field and touches points that I can imagine beginners might otherwise overlook. I hope publishing it here will be of use to some readers out there.

Update: as some readers have noted to me (by e-mail, and by commenting), this document touches very lightly on the topic of “finances” in R. I therefore decided to update the title from “R in finance – some tips for beginners”, to it’s current form.

Lastly: if you (a reader of this blog) feel you have an article (“post”) to contribute, but don’t feel like starting your own blog, feel welcome to contact me, and I’ll be glad to post what you have to say on my blog (and subsequently, also on R bloggers).

Here is the article:
Continue reading “Tips for the R beginner (a 5 page overview)”

ggplot2 plot builder is now on CRAN! (through Deducer 0.4 GUI for R)

Ian fellows, a hard working contributer to the R community (and a cool guy), has announced today the release of Deducer (0.4) to CRAN (scheduled to update in the next day or so).
This major update also includes the release of a new plug-in package (DeducerExtras), containing additional dialogs and functionality.

Following is the e-mail he sent out with all the details and demo videos.

Continue reading “ggplot2 plot builder is now on CRAN! (through Deducer 0.4 GUI for R)”

Want to join the closed BETA of a new Statistical Analysis Q&A site – NOW is the time!

The bottom line of this post is for you to go to:
Stack Exchange Q&A site proposal: Statistical Analysis
And commit yourself to using the website for asking and answering questions.

(And also consider giving the contender, MetaOptimize a visit)

* * * *

Statistical analysis Q&A website is about to go into BETA

A month ago I invited readers of this blog to commit to using a new Q&A website for Data-Analysis (based on StackOverFlow engine), once it will open (the site was originally proposed by Rob Hyndman).
And now, a month later, I am happy to write that over 500 people have shown interest in the website, and choose to commit themselves. This means we we have reached 100% completion of the website proposal process, and in the next few days we will move to the next step.

The next step is that the website will go into closed BETA for about a week. If you want to be part of this – now is the time to join (<--- call for action people). From being part in some other closed BETA of similar projects, I can attest that the enthusiasm of the people trying to answer questions in the BETA is very impressive, so I strongly recommend the experience. If you won't make it by the time you see this post, then no worries - about a week or so after the website will go online, it will be open to the wide public. (p.s: thanks Romunov for pointing out to me that the BETA is about to open)

p.s: MetaOptimize

I would like to finish this post with mentioning MetaOptimize. This is a Q&A website which is of a more “machine learning” then a “statistical” community. It also started out some short while ago, and already it has around 700 users who have submitted ~160 questions with ~520 answers given. From my experience on the site so far, I have enjoyed the high quality of the questions and answers.
When I first came by the website, I feared that supporting this website will split the R community of users between this website and the area 51 StackExchange website.
But after a lengthy discussion (published recently as a post) with MetaOptimize founder, Joseph Turian, I came to have a more optimistic view of the competition of the two websites. Where at first I was afraid, I am now hopeful that each of the two website will manage to draw a tiny bit of different communities of people (that would otherwise wouldn’t be present in the other website) – thus offering all of us a wider variety of knowledge to tap into.

See you there…